Data Animations for Arrastre
I was recently commissioned by Genevieve Smith-Nunes of readysaltedcode to produce some data visualisations/animations for their dance piece [arra]stre that premiered at the Brighton Dome as part of the Brighton Digital Festival. The aim of [arra]stre is to bring the new computing curriculum to a new audience through dance and computer animation.
My only brief was that there would be 5 themes:
- Boolean Algebra
- Debugging
- Algorithms/Data Structures
- Big Data
- Computational Thinking
and that I’d be working with motion data captured from the dancers using a Microsoft Kinect.
I ended up producing 5 original data animations that were used as a backdrop to the dancers at [arra]stre’s premiere.
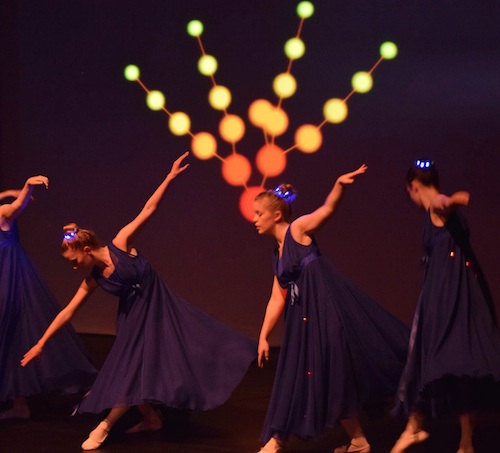
We captured motion data from the dancers using a Microsoft Kinect and Alex’s capture code produced 30 frames a second where each frame consisted of a skeleton consisting of 20 joints such as head, spine, hands and feet. It was with this data that I created the 5 pieces and in this article I’ll give some background into the 5 animations.
It was a great experience working with a very different brief to normal and it was a pleasure working with a diverse bunch of people including Genevieve Smith-Nunes, choreographers Paul Golz and Camilla Neale, tech-wizard Alex Shaw and Battle Abbey School.
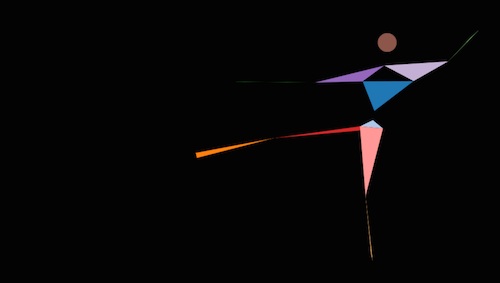
Boolean Algebra
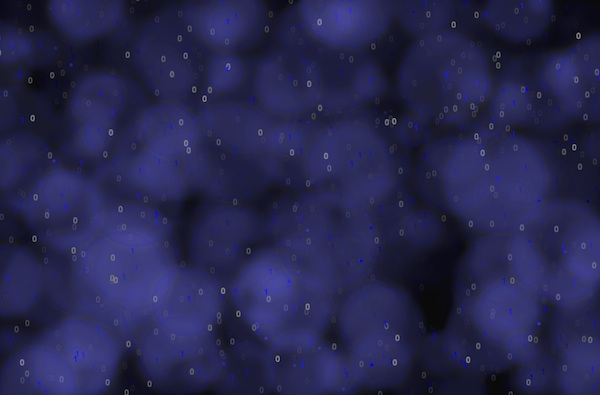
Boolean algebra is concerned with the manipulation of ones and zeroes and I wanted this animation to show that although data is usually represented in decimal the underlying representation is in binary (1s and 0s).
For each animation frame, each of the 20 joints was broken down into x, y and z values and coloured according to its value. As time progressed, more and more of the points were converted into binary representation and drawn as 1s and 0s.
To add some drama to the piece, the 1s were given a blue halo effect which helped tie the piece into the music, choreography and costumes.
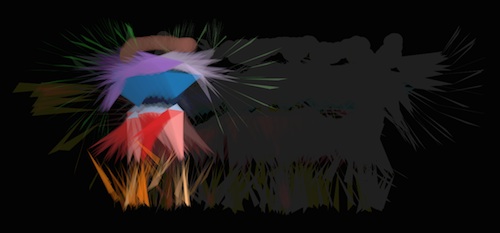
Debugging
Developing software is usually an iterative process involving debugging (spotting, diagnosing and fixing problems) along the way. This piece attempts to convey how a piece of software may look and feel in a buggy state and as bugs are fixed we see the piece evolve into its final state. This piece is also an opportunity to join the dots and actually see the data as though it really is a dancer.
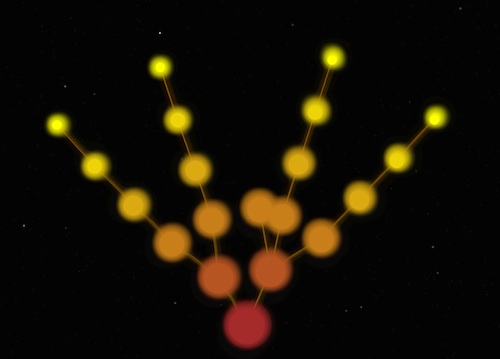
Algorithms/Data Structures
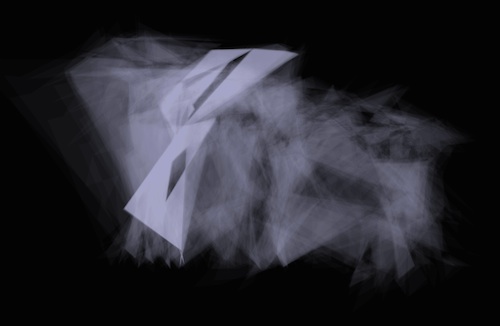
Although the data from the Kinect arrives as a list of body joints the body can be thought of as a network (a group of connected nodes) or more specifically a tree. Lists, networks and trees are fundamental data structures found in computing and I wanted to try and convey this. This animation begins by constructing a tree from the body’s joints, starting with the spine, then hip centre and shoulder centre etc.
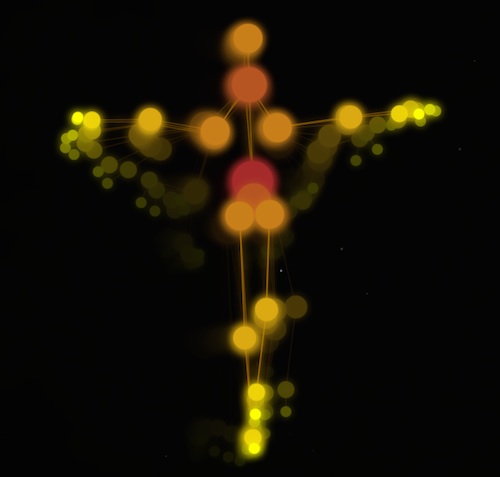
Around the mid-point of the choreography the music goes quiet and I thought this a good point where the tree would lose its ‘tree-ness’ and morph into the dancer. This is one of my favourite of the 5 pieces because it conveys that the real world can usually translate into one of the fundamental data structures found in comupter science namely lists, networks and trees and that when designing data visualisations I’m often thinking in these terms.
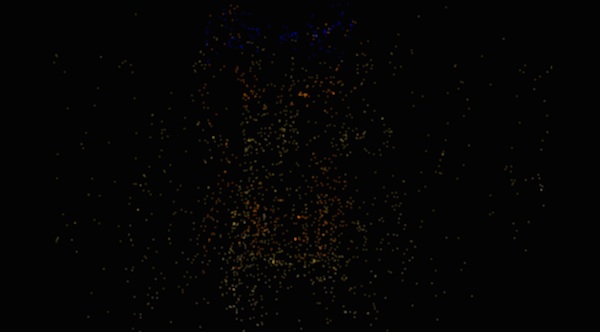
Big Data
Apparently more than 2.5 trillion gigabytes of data is generated each day now… which is a LOT of data! Although not exactly big data, the data produced by the Kinect is enough to begin conveying the amount of data that is now being produced in the world.
This animation is the simplest of the 5. At its heart is this piece of code:
_.each(data, function(d, index) {
  var x = Math.random() * width;
  var y = scale(d) % height;
  ctx.fillStyle = color(index % 20);
  drawCircle(ctx, x, y, 3);
});
which says: for every piece of data produced by the dancer draw a point at (x,y) where x is random and y is relative to the value of the data.
The resulting animation only begins to convey what big data looks like!
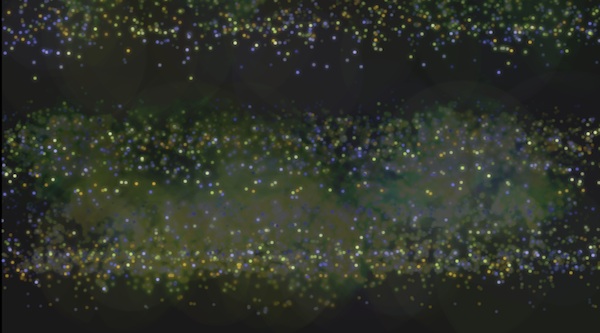
Computational Thinking
Computational thinking is a skill that programmers utilise to translate a real world problem into a set of instructions that a computer can understand. It involves analysis, modelling, abstraction, generalisation and testing.
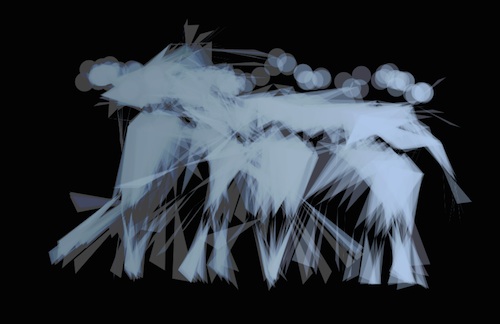
For me, one of the key strategies when writing code is to break the problem down into simpler pieces. This got me thinking: when faced with a big pile of dance data, what’s the simplest thing to do with it? My answer was to simply draw ALL of it to the screen. Unlike the other animations where the screen is faded between each frame this animation simply keeps drawing the dancer to the screen resulting in an animation that slowly builds up over time.
I ended up colouring the joints according to the type. For example, the head is coloured blue. Loosely speaking, this simple procedure produces a heatmap which displays the frequency with which each joint-type has visited a particular location in space.

Implementation details
Each of the visualisations was coded in JavaScript to run in a web browser. The Canvas element was used in all cases and D3 was used primarily for its scale functions & tree layout. The code can be viewed at [arra]stre’s website or downloaded from github.
Summary
This was a fantastic project to work on - it’s been great working to such an open brief and the performance day itself as part of the 2014 Brighton Digital Festival at Brighton Dome was great fun!
If you’d like to know more about these animations or are interested in working with me don’t hesitate to get in touch.