London DataStore Dashboard
London DataStore Dashboard
It’s always nice to work on projects where it feels like a real impact can be made so when I was approached by Tom Rees of DataPress to design and build the dashboard for the new London DataStore I jumped at the chance.
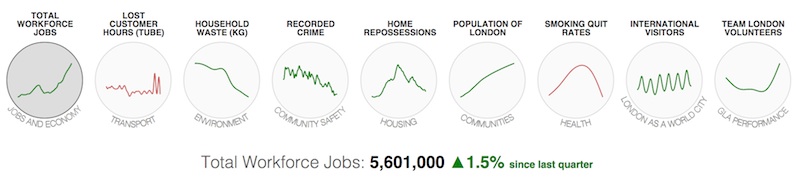
The new dashboard features a series of trend graphs for 9 key measures:
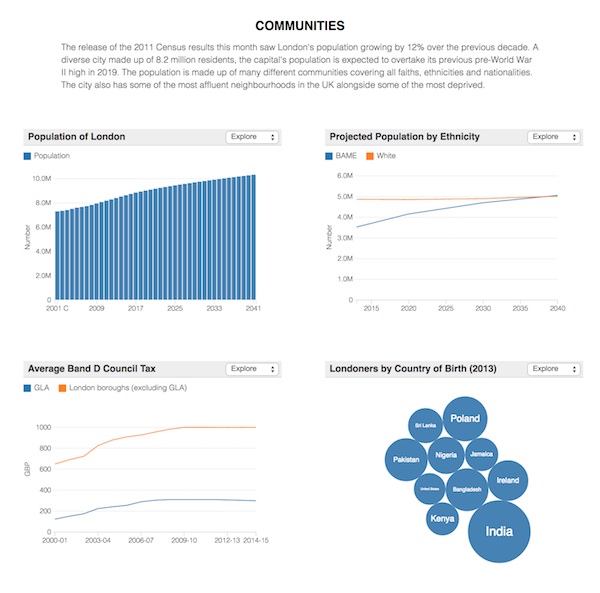
When an indicator is clicked, the dashboard expands to show a number of related charts:
All built using SVG and D3.js. Some of the nice things people said post-launch: